
From the gym peach basket to the lights in Madison Square Garden, basketball is a game that has captured the hearts and minds of the American people.
Passion. History. Money. Basketball has it all.
Well, I am not going to talk about any of that. Instead I will pick apart one of the greatest debates in the common era – who is better, Michael Jordan or Lebron James? Need to pick a side the next time this heated question comes up? Look no further, here comes the truth.
THE CORE FOUR
My analysis starts at the heart of the issue – who is better at basketball? I scraped their NBA data from Basketball Reference and analyzed this data by age to see development over time and see who is the king of the core four: points, steals, assists, and rebounds.
The graph below shows the average they maintained for each of the core four metrics over their age in years. Lebron is featured in yellow due to his new Lakers affiliation and Jordan in decked out in Bulls red.
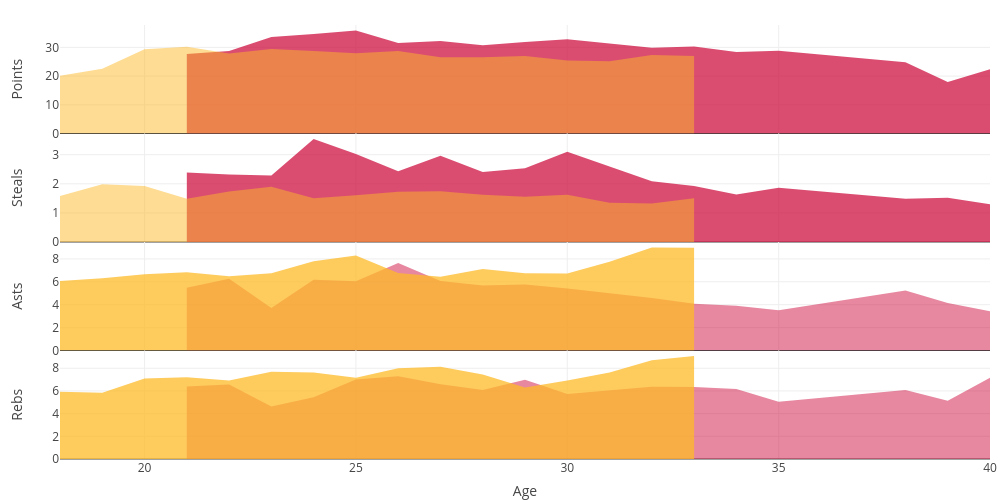
The darker color, yellow or red, indicates which player had a higher overall average. So, who is better based on this data? Well, it’s split. Michael Jordan performed at a higher level when it comes to points and steals, while Lebron James excels at assists and rebounds. Here is the aggregated data, based on their overall career game averages:
Points: MJ = 30.1, LJ = 27.10
Steals: MJ = 2.40, LJ = 1.60
Assists: MJ = 5.20, LJ = 7.20
Rebounds: MJ = 6.22, LJ = 7.35
There is a caveat with this data – Jordan’s data reflects 17 seasons of data while Lebron’s reflects 16 seasons. At what level would Lebron James need to perform this year to surpass Michael Jordan in every category?…
He would need to average 78.1 points and 13.7 steals per game. Probable? No. Doable? Also no.
Even with this preliminary information, a decision is not unanimous. A player’s legacy is defined by their impact on their team’s bottom line. In addition, it depends on a player’s consistency to produce.
Consistency
Game Score is a metric designed by John Hollinger (also the mind behind Player Efficiency Rating) that is designed to measure a player’s performance in a given game, considering 11 player statistics. I decided to graph the Game Score of each player by game with a linear model to determine the trend of their Game Score. If the slope of the line is more constant (that is, the line is flat) or more positive, we can pick the more consistent player, on average, across all metrics.

As it can be seen, Michael Jordan’s Game Score is not only not flat, but also has a relatively steep downward trend ending lower than where Lebron James started in his career. Lebron James, on the other hand, has a positive sloping line.
To echo this sentiment, before I start getting emails, let’s look at the data in a simple form: mean and standard deviation. Here are the results:
- MJ Game Score: Mean: 23.44, SD: 9.48
- LJ Game Score: Mean: 22.22, SD: 7.79
On average, Jordan will have a higher game score. But, he also has a lower floor.
95% of the time Michael Jordan’s Game Score is between 4.48 and 42.4.
95% of the time Lebron Jame’s Game Score is between 6.64 and 37.8.
What does this mean? If you have a young Michael Jordan, take him. If both players are in the last half of their careers, take Lebron James. If you are building a team around a consistent player with potential in the long run, take Lebron James.
Output
What could effect Game Score? Well, it could be the players you are surrounded by and their workload. But, I am not in the business of analyzing interactions across teams – I am analyzing these two champions in a unique bubble, as individuals.

That being said, the other component that could influence Game Score and performance is fatigue. The left graphic shows the number of minutes each player played by game, by season, and by career (so far). Notice that Lebron plays more minutes. In addition, he plays 71 games on average in a season, compared to Michael Jordan’s 63 per season. To this point, Lebron James has played 48 more hours in game time situations than Michael Jordan did, with one less season under his belt. If we extrapolate through this year, Lebron’s 17th season, he will have played 5,328 more minutes of basketball, throughout his career, than Michael Jordan in the same amount of seasons. If you are looking for a workhorse, pick Lebron James.
Winning Games
Who has a higher career winning percentage? Lebron James, at 66.5%. Michael Jordan is not far behind at 65.9%. But, even with this knowledge, it may be more important to see who contributes more to their team’s success.
Using the performance statistics at hand, I ran linear models to determine which player accounts for a higher percentage of their team’s overall success in winning games. Michael Jordan’s 3-point ability, blocks, and turnovers had the greatest effect on the outcome of a game he was playing in. On the contrary, Lebron Jame’s general field goal total, rebounding, assists, steals, and turnovers contributed significantly to team success.
Again, I am analyzing these two in a bubble. Even so, the ultimate judge of contribution can be judged by their adjusted R-Square values.
5% of the variability between winning and losing can be explained by Michael Jordan’s outputs during a basketball game. For a single contributor, omitting interactions, other players, and uncontrollable variables, this isn’t terrible. But, Lebron James accounts for double this statistic. That is…
10% of the variability between winning and losing can be explained by Lebron Jame’s outputs during a basketball game. On this fact alone, holding everything constant, Lebron James contributes more to his team’s overall success.
Michael Jordan vs Lebron James: The Ruling

While Michael Jordan was known to light up the score board and be a cookie robber in the lane, Lebron James is a better distributor and puts in work on the glass. Lebron also is more consistent over all categories game to game, with an upward trend in his Game Score average. Lastly he is the definition of a workhorse and has double the impact on his team’s success.
That being said, Lebron James is the truth.
Compared to Lebron James, it appears that Michael Jordan’s ceiling really is his roof.
Come back in 23 years when I complete my analysis on Lebron James vs Bronny Jr.
Enjoy this post? Take a look at past posts:
