
Around 60% of restaurants fail within the first year (CNBC).
If you or a loved one is looking to break into this promising industry, I am here to help with my new set of data skills. Thanks to the Zomato API, I was able to find data on restaurants listed on the Zomato platform. Zomato (previously Urban Spoon) is a platform that allows users to rate restaurants based on their experiences. If you are planning to put your restaurant on Zomato, or other platforms, this information may help you to stay in that upper 40%…
CONVENIENCE IS KING
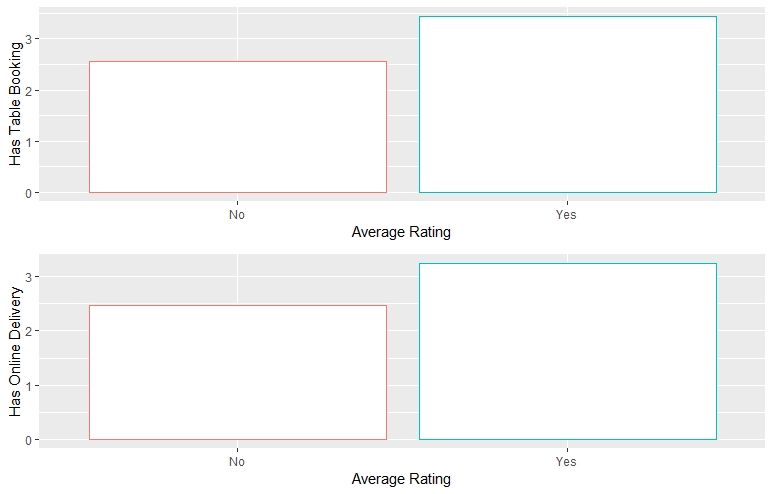
By analyzing ~10,000 restaurant data points across 15 different countries on the Zomato platform, we see that certain attributes have a positive relationship with higher average rating. In fact, restaurants that offer online table booking and online delivery forms had, on average, a 1 star higher average rating (out of a possible 5 stars). If a restaurant makes dining easier on Zomato, and likely other apps, it may improve its perceived quality.
WHAT ABOUT PRICE?
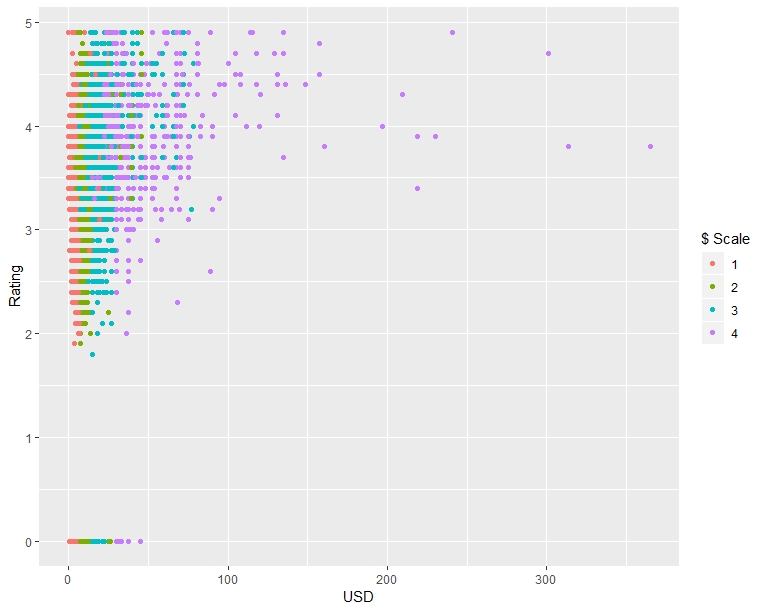
After converting international currency to USD, I looked at the relationship between rating and price. While there appears to be no strong relationship between rating and how much a person spends, overall, we can see that restaurants that cost over $100 for a meal tend to be over 3 stars. My guess – the data is skewed, because nobody wants to admit that they spent that much on a hot pile of garbage. But, I digress.
What is more fascinating in this data set is the inherent discrepancy in the way they rank restaurants based on price (otherwise known as the $ to $$$$ scale). If you look at the coloration of the dots, you’ll see that they are intertwined in some places of the graph. This indicates that there is variability within their own system for how they rank restaurants. For example, if you look at the $100 line, you will see that there are restaurants ranked as $$$ and $$$$ slightly above the line and restaurants ranked as $$, $$$, and $$$$ slightly below the line. Technology and algorithms aren’t full proof, huh?
WHAT ABOUT CUISINE?
Restaurants have the ability to tag their cuisine in the app, from “Dim Sum” to “Raw Meats”. So, what do people like to eat?
Dividing by the first 5 descriptors for each restaurant in the data set (and filtering on words/tags that appeared more than 50 times in restaurant descriptions), I have uncovered the world’s fan favorites (cuisine: average restaurant rating)…
- Sandwich: 4.08
- Steak: 3.99
- Sushi: 3.97
- Mediterranean: 3.94
- Indian: 3.93
- European: 3.91
- Seafood: 3.86
- Asian: 3.81
- Japanese: 3.79
- Mexican: 3.72
One key takeaway is to be broad in the terms you use to describe your cuisine; this tends to result in higher average ratings (especially if you prepare Indian cuisine, you’ll see my point below). And, the cuisines that had the lowest average rating…
- Mithai: 1.97
- Raw Meats: 2.15
- Street Food: 2.35
- Biryani: 2.42
- Bakery: 2.44
- South Indian: 2.47
- North Indian: 2.51
- Fast Food: 2.56
- Ice Cream: 2.57
- Mughlai: 2.61
I, personally, love ice cream and Indian food. But we can’t all have my refined palette. Elaborating on my point before, we see that Indian food is a crowd favorite (at least when looking at average ratings of restaurant cuisines). But, more granular specifications of Indian cuisine tended to rank lower.
FINAL THOUGHTS
Center your online restaurant world around convenience (from online delivery to booking tables). Charge $100 or more and you’ll probably get at least 3 stars. Charge less and you may see variability in the number of $ signs you see next to the restaurant name in the Zomato app. Finally, be broad in your restaurant descriptions and avoid opening restaurants that you would put in the “Raw Meats” category.
Tune in next week, where I will give more advice about a field/business/industry that I know nothing about.
* I am in no way qualified to give out restaurant advice…
