
When you think of happiness, what comes to mind? Is it money? Is it success?
In 2017, the “World Happiness Report” was presented to the United Nations in an attempt to quantify which countries are the “happiest”. In this report, happiness (or well-being) is a summation of six quality attributes: economic production, social support, life expectancy, freedom, absence of corruption, and generosity. The data was produced using nationally representative samples, in which respondents were asked to think in terms of this fundamental scenario – “to think of a ladder with the best possible life for them being a 10 and the worst possible life being a 0 and to rate their own current lives on that scale.”
While this is a simplistic approach to understanding happiness, I have tasked myself with understanding where different regions rank in well-being, which of the six attributes are linked to self-reported happiness scores, and the idea of Dystopia (more on this to come).
THE REGIONS
So, what are the top 10 countries in this report you may ask? They are as follows:
Norway, Denmark, Iceland, Switzerland, Finland, Netherlands, Canada, New Zealand, Sweeden, and Australia.
There are 156 countries accounted for in the “World Happiness Report”. After joining geographic regions to the report, we can see the average rank of countries within a region. Below are the results (Region: Average Country Happiness Rank):
North America: 10.5
South/Latin America: 50.8
Europe: 51.8
Asia & Pacific: 79.7
Arab States: 81
Africa: 129
Numerous European countries are accounted for in the top 10, yet they rank 3rd in average happiness as a region. While individual countries have high levels of well-being, the greater number of countries, along with the greater discrepancy in happiness scores and rank between the countries, causes this continent to be disjointed in qualities of life. This a common theme for the regions in the middle. North America is separated at the top by only having 3 participating countries ranked at 8 (Canada), 15 (USA), and 26 (Mexico). Africa is on the opposite end of the spectrum, with their highest ranking country, Mauritius, being ranked at 64 and the rest of its 35 members being ranked 95 or lower.
While this information is useful, how do the 6 major criteria (economic production, social support, life expectancy, freedom, absence of corruption, and generosity) relate to a country’s overall happiness score? Let’s take a look.
THE BIG SIX
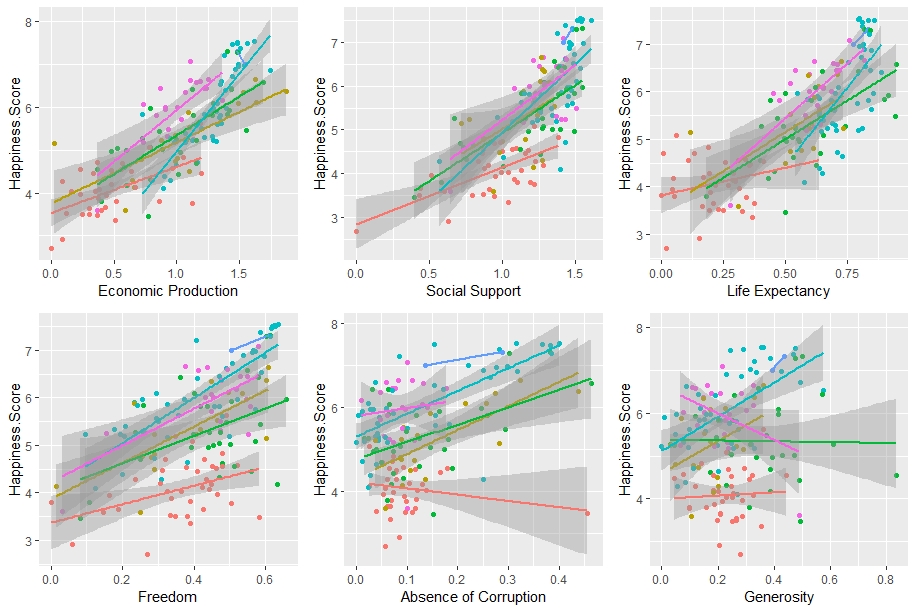
 These graphs show each of the 6 major factors graphed against happiness scores for each country, colored based on the region in which they reside. The trend lines show a rough relationship between these variables, based on region. What trends and relationships do you begin to see?
While I am not diving into statistical significance on this post (please don’t email me…), some definite trends start to emerge. Regardless of region, greater economic production, social support, life expectancy, and freedom tend to give way to greater happiness, as defined as a sense of well-being. As you may notice, regions that, on average, ranked higher in overall happiness tend to have countries that score higher on these attributes.
While this is the case, relationships are a bit more muddied when looking at absence of corruption and sense of generosity. For Asia, Europe, and Arab States, absence of corruption tends to lead to a greater sense of happiness. Absence of corruption has less of a pull for countries in the Americas and Africa. Likewise, Africa and Asia do not have a tendency to let generosity affect their levels of happiness, compared to North America and Europe. Interestingly enough, happiness and generosity have a negative relationship for countries in South/Latin America.
Now, the key to all this data is that it is compared to a hypothetical Dystopia. We’ll now uncover which countries are most likely to be compared to this in the real world.
DYSTOPIA
A Dystopia, by definition, is an imaginary country in which everything is unpleasant (think George Orwell). In our playground, it is inhabited, theoretically, by the world’s least happy people. By comparing countries to this Dystopia as a benchmark, it allowed the report and its results to be positive in analysis. The Dystopia, in our case, is based on the lowest scores for each of the 6 major attributes. Let’s dig a little deeper and discover which countries would constitute our Dystopian society…
*This is simply meant for analysis. It is in no way condescending and should be used to guide action to lift up people who are affected by these conditions, not put them down*
6 Factors of our Dystopian Benchmark
- Economic production of Central African Republic
- Social support of Central African Republic
- Life expectancy of Lesotho
- Freedom of Angola
- Absence of corruption of Bosnia and Herzegovina
- Generosity of Greece
4 of our benchmarks are based on countries in Africa (2 are from the same country), while the remaining 2 are found in the southeastern part of Europe. Let this information serve as a catalyst to help those who have been marginalized against.
FINAL THOUGHTS
Happiness is not necessarily a choice. A country (and inherently, its region) is set up for well-being based on its geographic location, history, and access to resources. This manifests itself in economic production, life expectancy, and absence of corruption. In addition, cultural norms surrounding social support tend to play a role in a citizen’s overall well-being. Similarly, generosity plays different roles depending on regional differences. There is no perfect formula for creating well-being.
Lastly, it is in an undeniable right to be happy. No one deserves to live in a Dystopia.
Thanks for following my journey as I produced my first blog post using R Software. Share if you liked it and don’t hesitate to reach out. More is to come!
